


- Top Page >
- Technology
- Organic Conception Diagram
Technology
What is "formulation design with organic conception diagram"?
 For more effective development of formulation
Our company has conceived "The emulsification formulation design method using the organic conception diagram" as was detailed in 1950, and efficiently provide with a emulsifier and formulation that fills the needs of the customer.
The formulation designing method includes the prediction of emulsion properties in addition to information on temperature stability and the method of its correction.
If they were skillfully utilized, it would be possible to effectively develop intended formulas with minimal emulsification tests.
This page introduce the summary.
We would be happy if your perusal of this page was to prove useful to the formulation researchers.
 About an organic conception diagram
2-1.Organic Conception Diagram
The "Organic Conception Diagram"* has been widely applied especially in the field of environmental chemistry, pharmaceutical chemistry, etc. as means that express the property of organic materials that feature relatively complex interactions. Since then we discover of the fact the Organic Conception Diagram provides a sure guide for assessment of a surfactant, we judge properties of matter of the emulsion visually, by finding a value of "Organic Value" and "Inorganic Value" from chemical structure. Judge by expressing each two-dimensional plane of raw materials included in the emulsification prescription as a point in the planes.
*Regarding the details of "Organic Conception Diagram", please refer to "Qualitative analysis of organic substance: by Makoto Fujita", etc.
2-2.Organic Value and Inorganic Value
In the principles of Organic Conception Diagram, the property of a compound in terms of physical chemistry is considered in such a way that the property that depends much on Van Der Waals force is called "Organic nature" and the one that depends much on electric affinity is called "Inorganic nature".
Thus considering the property of a compound is expressed by a combination of two characteristic values, organic value = OV and inorganic value = IV.
Accordingly, one can easily imagine that the characteristics of an organic chemical compound can be predicted by identifying the characteristic values of the OV and the IV that are inherent to each compound.
When the data from a large number of chemical compounds are marked on the Organic Conception Diagram, various trends specific to that property are found in each region of the two-dimensional plane.
Conversely, it could mean that if the organic value and the inorganic value of an unknown compound were determined from the structural formula or other factors, the characteristics of the compound could be predicted.
Fig.1 Characteristics seen in the organic conception diagram
| Field | |
|---|---|
| A | Sand-like crystal zone |
| B | Needle-like crystal zone |
| C | Plate-like crystal zone |
| D | Zone of concomitant (Presence of plate-like and needle-like crystals) |
| Trace | |
|---|---|
| 1 | Crystal threshold line |
| 2 | Melt threshold line |
| 3 | Volatility threshold line |
| 4 | Odor threshold line |
| 5 | Liquid threshold line |
| 6 | Gas threshold line |
Fig.2 Similar compounds appearing on the organic conception diagram
| No. | α | Surfactant, Dyeing, etc |
|---|---|---|
| 1 | 0~40° | Oil-soluble solvents |
| 2 | 10~75° | Plasticizers |
| 3 | 23~45° | W/O SAA (HLB 3~6) |
| 4 | 25~55° | Cationic SAA |
| 5 | 10~60° | Nonionic SAA |
| 6 | 40~44° | Foaming auxiliary agents |
| 7 | 55~75° | Anionic SAA,Rinse agents |
| 8 | 55~75° | O/W SAA (HLB 8~18) |
| 9 | 25~35° | Oil-solublu dyes,Dispersion dyes |
| 10 | 35~65° | Organic pigments |
| 11 | 65~75° | Alcohol-soluble dyes |
| 12 | 75~85° | Penetrant,Emollient NMF |
| 13 | 75~85° | Water-soluble dyes |
| 14 | 55~85° | Water-soluble polymers |
2-3.Interrelationship with HLB Method
HLB (Hydrophile Lipophile Balance) generally used to express the surfactant properties, expresses the relative intensity of the properties of hydrophilic and lipophilic groups of surfactants.
In the HLB method, the properties of raw materials are expressed by the relative sizes of the HLB values.
However, when a formulation contains more than several kinds of compounds, it is difficult to predict the properties of the formulation by the relative size of the HLB values.
In the organic conception diagram, not only surfactants, but also all compounds can be deployed and expressed on the two-dimensional organic conception diagram so that with respect to mixtures made up of several raw materials, the properties of mixtures to be produced can be predicted more accurately.
Moreover, the concept of organic value and inorganic value in the organic conception diagram is highly interrelated with the concept of hydrophily and lipophillicity in the HLB method.
Therefore, as the ratio of an organic value and an inorganic value in the organic conception diagram principle is provided by "inorganic value (IV)/organic value (OV) = IOB", when the IOB value and the HLB value of a compound is compared, "HLB = IOB×10" can be established as an approximate equation.
Fig.3 Correlation of HLB and Organic Conception Diagram

 Formulation design with organic conception diagram
The design of formulation using the organic conception diagram indicates the type of formula established and enables prediction of the properties, the feel of use from the visual rearrangement of positions of the ingredients located on the organic conception diagram, and the tendency of the mixed quantities, in accordance with the procedures described below: The predication of properties is made by first arranging "types of formulas", "tendency of the quantity of surfactant" then by applying the findings to the "Tendency list of quality and quantity".
- Procedure 1.
- Locating of Ingredients
Organic and Inorganic values of ingredients are determined and located on the organic conception diagram.
- Procedure 2.
- Entry of Trisection Lines (A Line & B Line)
To determine the balance of surfactant visually easily, enter two lines which divide the angle formed by the axis of least α material among ingredients and inorganic axis, into three equal parts.
(In the method of organic conception diagram, in particular, the word "surfactant" denotes all ingredients other than oil having the smallest polarity [α small] in the formula and Aq with the largest polarity [α=90°], irrespective of the properties of actual ingredients.)
Fig.4 Trisection Lines and Locating
| Ingredients | quantity (wt%) |
OV | IV | α |
|---|---|---|---|---|
| 1.Mineral Oil | 28.55 | 320 | 0 | 0° |
| 2.EMALEX CC-168 | 0.90 | 470 | 60 | 7° |
| 3.Cetylalcohol | 1.85 | 320 | 100 | 17° |
| 4.EMALEX 102 | 3.70 | 440 | 195 | 24° |
| 5.EMALEX 400di-S | 0.85 | 1040 | 645 | 32° |
| 6.EMALEX 611 | 0.40 | 800 | 870 | 47° |
| 7.EMALEX 720 | 0.20 | 1040 | 1545 | 56° |
| 8.PEG-600 | 0.10 | 480 | 1025 | 65° |
| 9.Sodium Stearoyl Glutamate | 0.05 | 460 | 1000 | 65° |
| 10.Water | 63.40 | 0 | 100 | 90° |
| Total | 100.00 | |||
B
A
- Procedure 3.
- Classification of the Types of Formulas by Quantity of Ingredients
The types of emulsion (Type A or Type B) are classified by where the most mixed quantity of surfactant is located on the organic conception diagram and how the mixed quantity is distributed.
Fig.5 Classification of the Types of Formulas
by Quantity of Ingredients
| Type of Formula | Commentary of Type |
|---|---|
| TypeA | Emulsion in which most surfactant is located in the vicinity of Line A and the mixed quantity of surfactant increases toward the vicinity of Line A. OSAA= Organic axis to Line A WSAA= Line A to Inorganic axis |
| TypeB | Emulsion in which much surfactant is located in the vicinity of Line B and the mixed quantity of surfactant increases toward the vicinity of Line B. OSAA= Organic axis to Line B WSAA= Line B to Inorganic axis |
- Procedure 4.
- Classification by Positions of Ingredients
Classification by positions of ingredients is defined by the position of surfactant whose distance from the origin to line A or line B is the furthest.
Moreover, for ingredients closest to the organic axis or inorganic axis of the oil phase surfactant or water phase surfactant, compare their distance from their respective origins.
Fig.6 Classification by Positions of Ingredients
| Explanation of the peak of the length | |
|---|---|
| ℓA | Ingredient which is the longest the distance from the origin exists near to line A. |
| ℓB | Ingredient which is the longest the distance from the origin exists near to line B. |
| ℓ : S | When the distance from the origin of "OSAA in the smallest α" was taken as x and "WSAA in the largest α" was taken as y. If it is x>y, assume it "ℓ:s". |
| S : ℓ | When the distance from the origin of "OSAA in the smallest α" was taken as x and "WSAA in the largest α" was taken as y. If it is y>x, assume it "s:ℓ". |
- Procedure 5.
- Prediction of Properties and Feel of Use
In the design of emulsion formulas using the organic conception diagram, the properties of emulsion, temperature stability and the feel of use are predicted by the above mentioned classifications, and in reference to our "tendency list of quality and quantity".
Fig.7 Analysis example by the model
of the established formula

| Subject | Result | Comment |
|---|---|---|
| A or B | type B | More emulsions around line B. |
| ℓA or ℓB | ℓA | "Ingredient No.7"around line A is of the longest distance from the origin among formulation components. |
| ℓ:S or S:ℓ | S:ℓ | The distance of "ingredient No.2" with the minimum α from the origin among oil phase components is longer than the distance of "No.9" with the maximum α from the origin among water phase components. |
| O:W | O=35 | Sun of 4 components with in the zone of 0°to line B. |
| W=65 | Sun of 6 components above line B. | |
| OSAA:WSAA | OSAA=6.45 | Sun of 3 components except liquid paraffin in oil phase. |
| WSAA=1.6 | Sun of 5 components except water in water phase. | |
| Number of locus | 6 | See tendency table |
*Our company therefore conducted emulsification tests by giving a variety of parameters to typical formulas consisting of mineral oil, nonionic surfactants and water, and the results obtained were compiled into the "tendency list of quality and quantity". It has been shown that the list is in high agreement with the general properties of formulas and tendencies despite the evaluation of limited formulas.
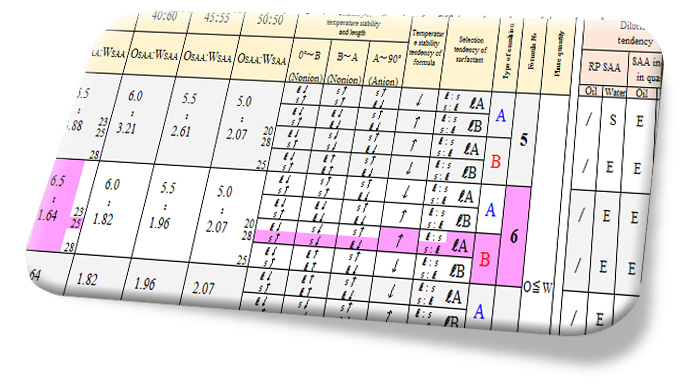
Fig.8 Tendency list of quality and quantity (to pick out)